

Who’s ready to surface some more powerful insights you’ve already spent time building out in Power BI, in the canvas apps people in your organisation interact with on a daily basis? 🧐 Keep reading this post to find out how to do it so users can get the quick insights or specific pages they need whilst taking action in your apps, without having to deep dive into full detailed business insights reporting solutions! Keep that user experience in mind friends! 🥰
Power BI Dashboard Tiles
So, let’s start by taking a look at what’s compatible here. When it comes to surfacing visuals in Power Apps from Power BI, we’re able to surface tiles that sit on dashboards in the Power BI service. So this doesn’t necessarily mean we’ll be surfacing entire reports, or entire dashboards in one control, but perhaps a specific page or two from a report that are key for people to be visible to when taking action using the tools in Power Apps they’ve got! 🚀
Creating tiles ready
So, let’s take a Power BI report I have here, and in the service we’ll create a dashboard from the visuals creating tiles which we’ll be able to use in our canvas app! So, I have a super ugly report here which we’ll use to test out the functionality, but by all means, please DO NOT put something that looks like this in front of your people! 👀
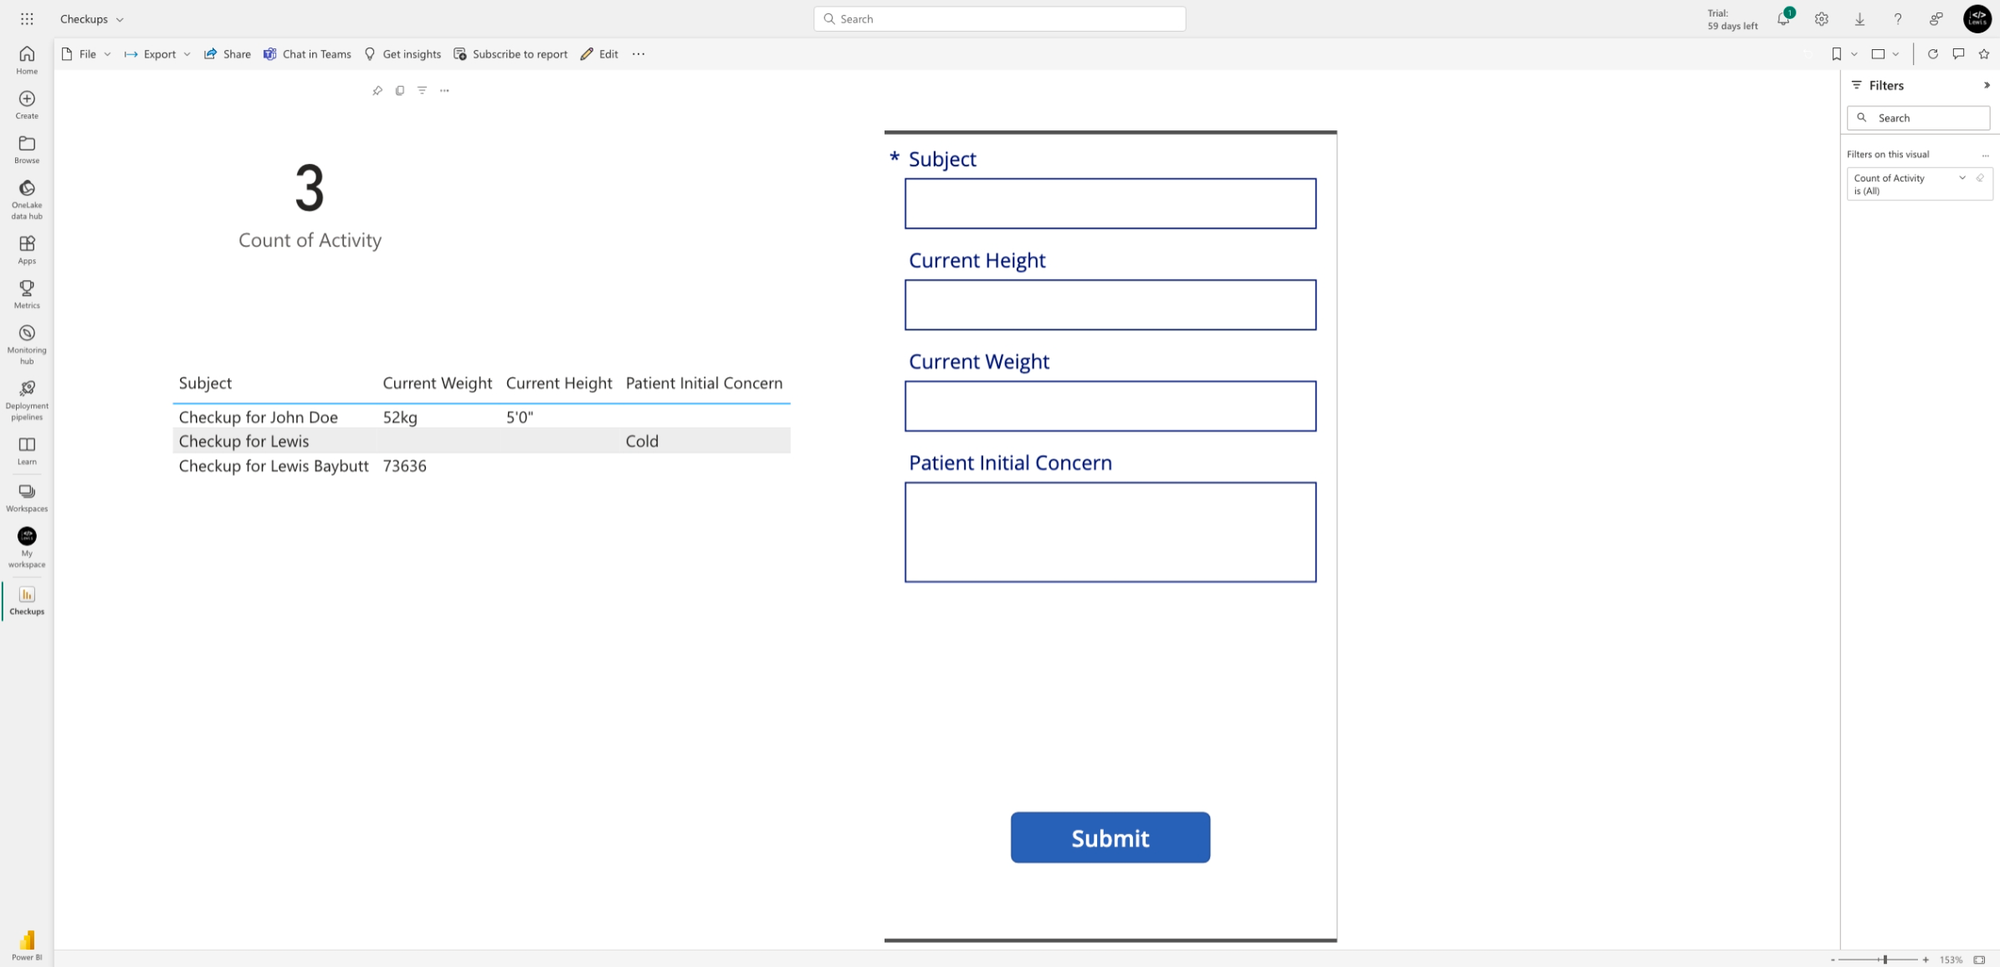
Now on this page, I’m going to select the three dots next to the edit button and I’ll select pin to dashboard. Then I’ll create a new dashboard and select ‘Pin live;.
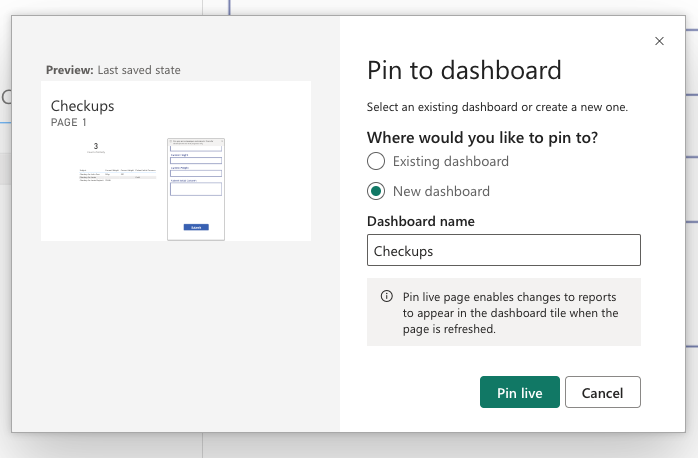
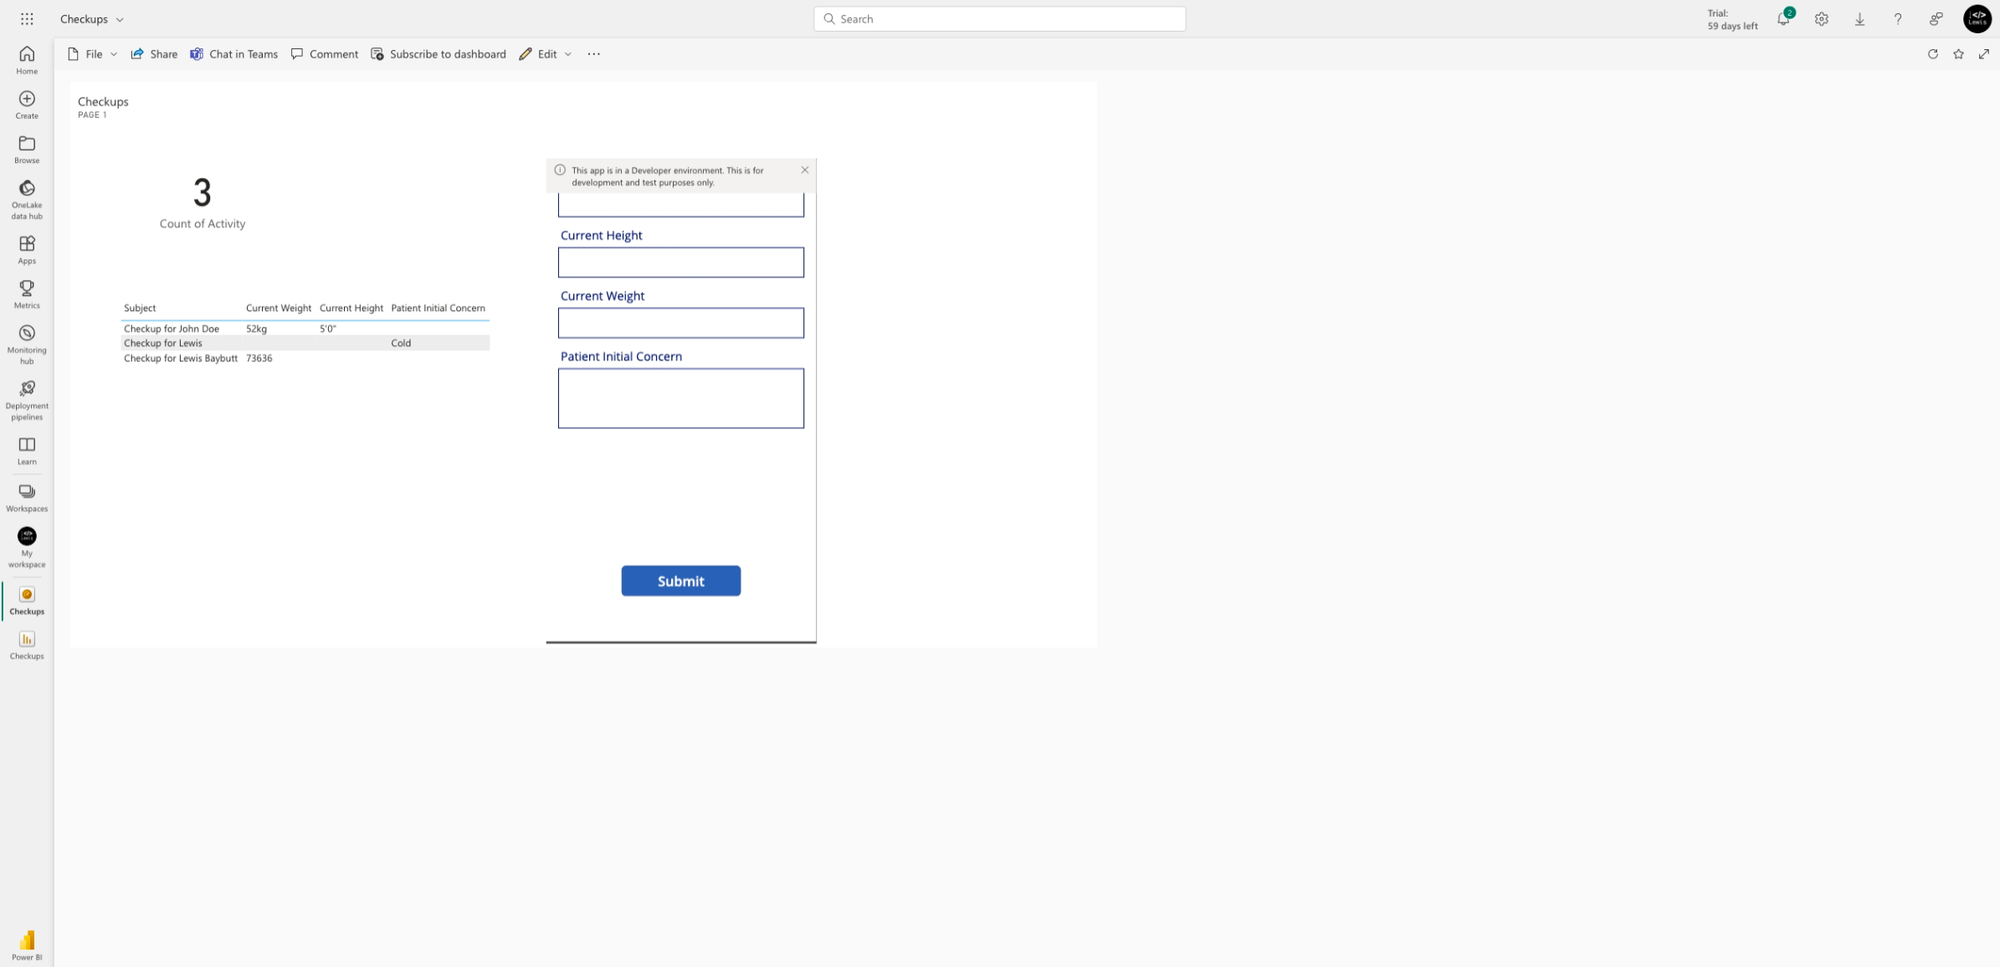
Now I have a dashboard with my page from my report pinned as a tile.
Surfacing a tile in a canvas app
Now let’s take a look at how we can surface a tile in a canvas app. I’m going to head into my app and add the Power BI tile control.
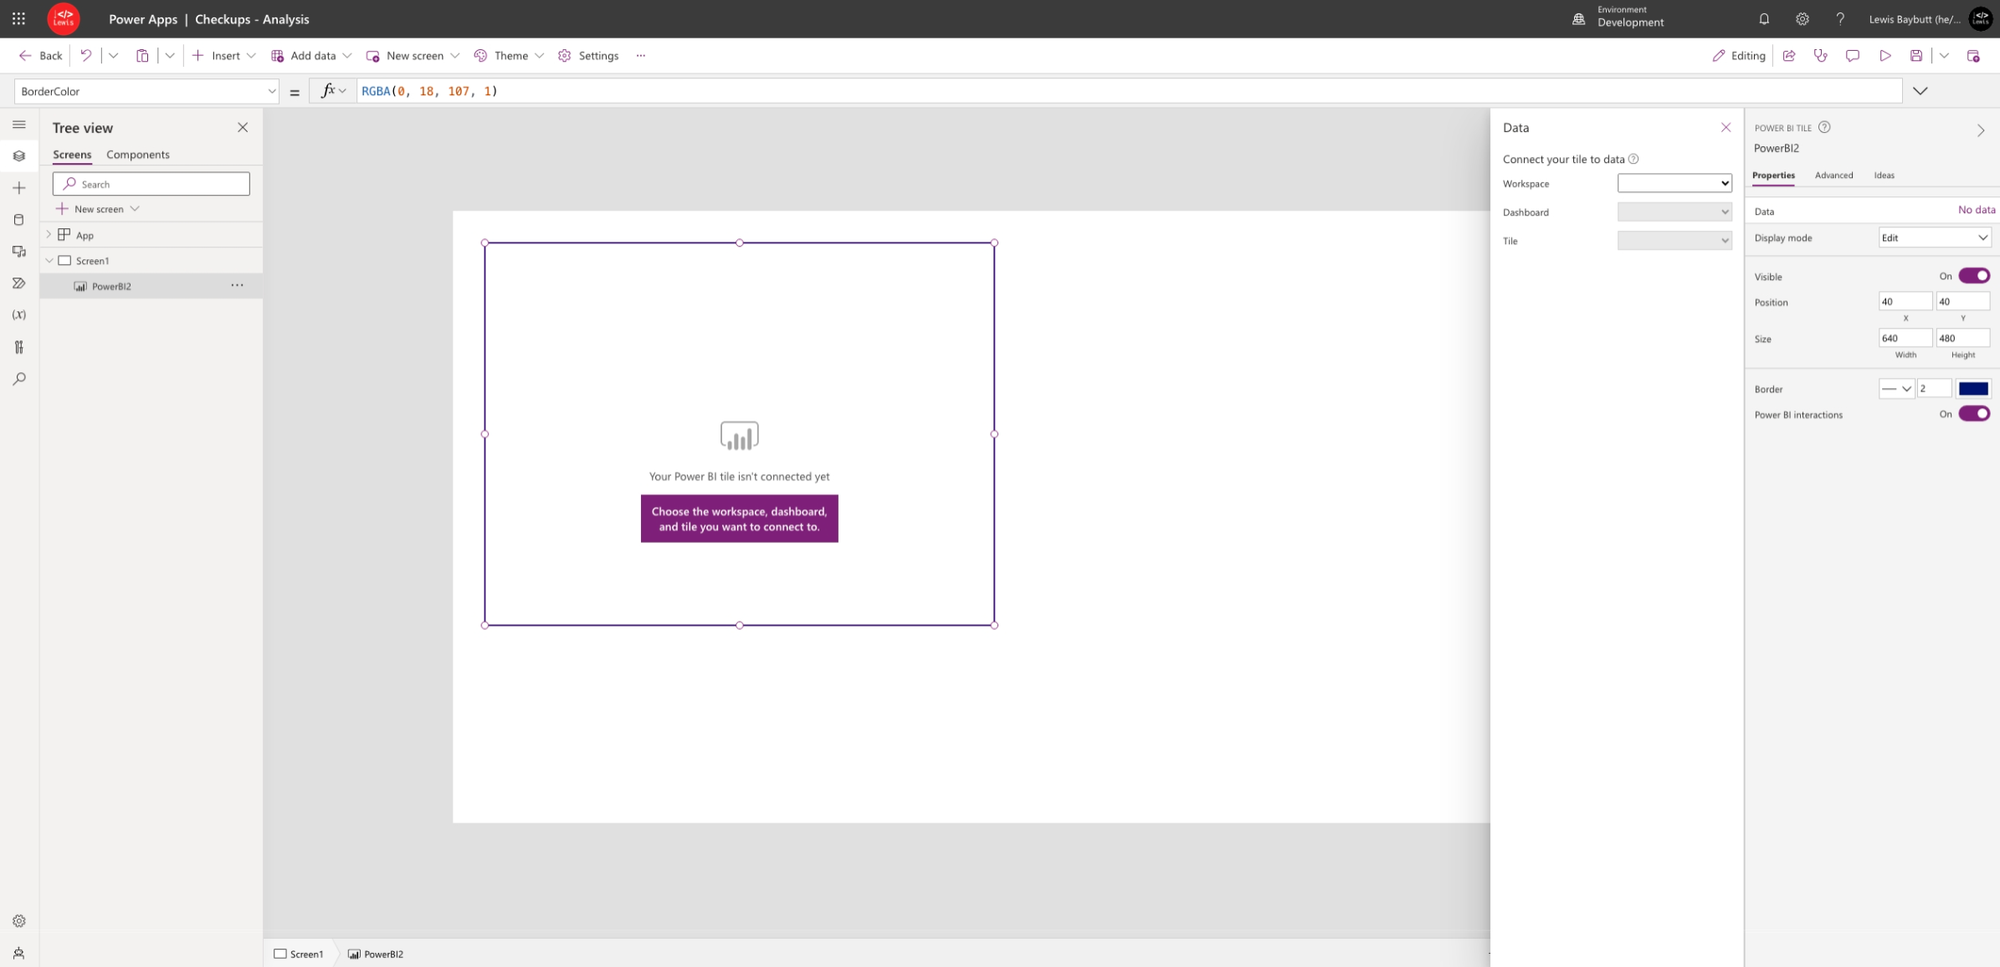
Now all I need to do is select the workspace my dashboard is in, then the dashboard and finally the tile you want to surface. Now check it out! I have my Power BI content being surfaced right in my canvas app! Oh and yes, in this example I have an app embedded in a dashboard tile, embedded in an app! 🤩 😆 … aka… an example of how not to build for your people!
So friends, that’s it! Let me know in the comments what you’ll do with this functionality! 🥰
Did you like this content? 💖
Did you like this content? Check out some of the other posts on my blog, and if you like those too, be sure to subscribe to get my posts directly in your inbox for free!
Subscribe